Lecture 24: Normal Approximation for Experiments#
STATS 60 / STATS 160 / PSYCH 10
Concepts and Learning Goals:
Use the normal distribution to approximate the \(P\)-value for a randomized experiment.
Review#
A randomized experiment allows us to conclude causality.
But even if the difference in means between the two groups is not exactly zero, the signal may still just be noise.
We consider this possibility using the potential outcomes model.
Every subject has a potential outcome under control, \(Y_i(0)\), and treatment, \(Y_i(1)\).
We only observe one of these potential outcomes.
But under the null hypothesis that the treatment has no effect, we can fill in the missing potential outcomes.
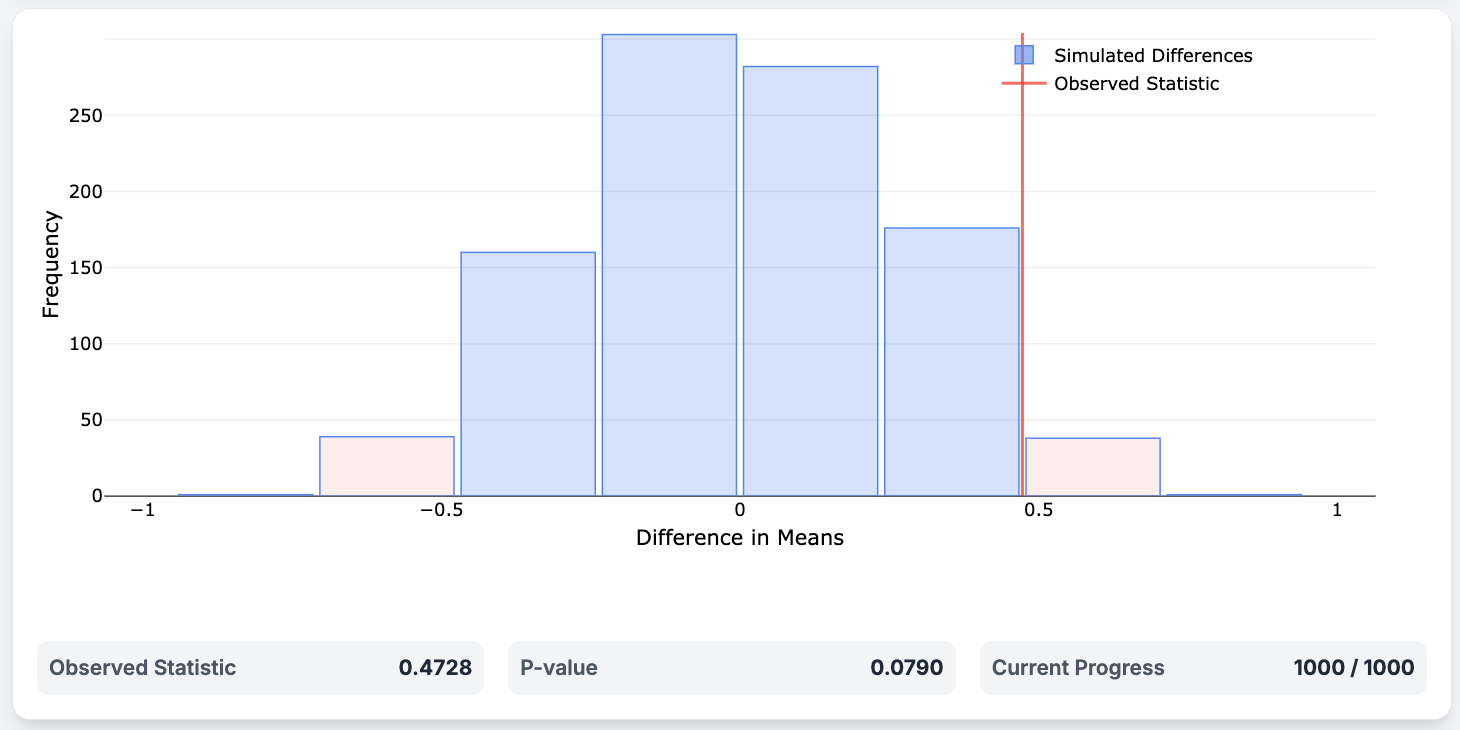
Now we can simulate (under the null hypothesis) the difference in means for alternative random assignments in the multiverse.
The number of alternative universes where the treatment has an effect (at least) as large as our universe is the \(P\)-value.
Retrieval Practice Experiment#
Here’s the data that we collected from the randomized experiment in
class on Monday and Wednesday.
We can copy and paste it into the potential outcomes applet to simulate random assignments in alternative universes.
potential-outcomes.github.io{target=”_blank”}

Normal Approximation for Randomized Experiments#

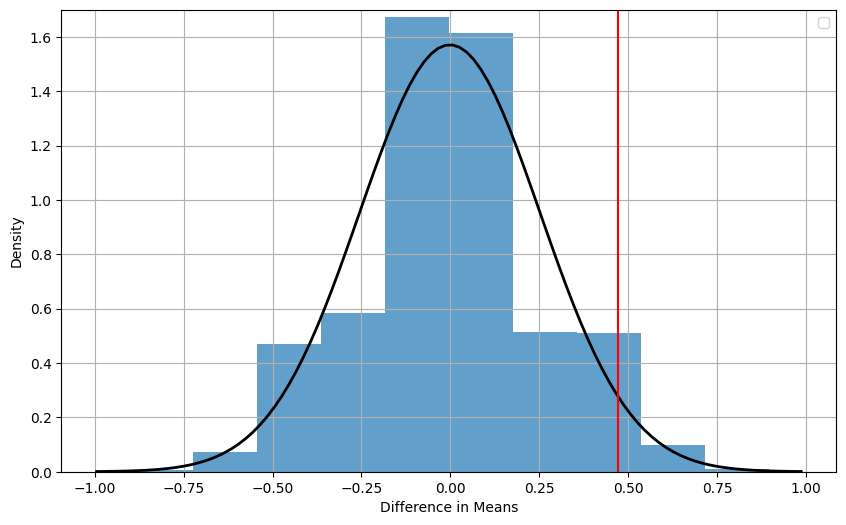
Under the null hypothesis that the treatment has no effect, the distribution of the mean difference approximately follows a normal distribution, with
mean \(0\)
standard deviation \(\sqrt{\frac{\sigma_0^2}{n_0} + \frac{\sigma_1^2}{n_1}}\)
The standard deviation for our data is approximately \(\displaystyle\sqrt{\frac{0.86^2}{16} + \frac{0.63^2}{23}} \approx 0.25\),
so the observed difference of \(|3.35 - 2.88| = 0.47\) is less than \(2\) standard deviations away from the mean of \(0\).
So the \(P\)-value is greater than \(5\%\), and we cannot reject the null hypothesis.
Normal Approximation for Randomized Experiments#
Obtaining a more precise \(P\)-value using the normal curve requires the use of software.
However, keep in mind that the normal distribution is only an approximation, and this \(P\)-value is not exact.
Recap#
The potential outcomes model is used to determine if the difference between two groups in a randomized experiment can be chalked up to chance.
The \(P\)-value can be obtained by simulating alternative random assignments in the multiverse and calculating the proportion of multiverses in which the difference is as big as (or bigger than) the one in our universe.
The normal distribution can be used to approximate the \(P\)-value.
Under the null hypothesis, the mean is \(0\) and the standard deviation is \(\sqrt{\frac{\sigma_0^2}{n_0} + \frac{\sigma_1^2}{n_1}}\).
#
Control |
Sleep Deprivation |
|
|---|---|---|
\(25.2\) |
\(-10.7\) |
|
\(14.5\) |
\(4.5\) |
|
\(-7.0\) |
\(2.2\) |
|
\(12.6\) |
\(21.3\) |
|
\(34.5\) |
\(-14.7\) |
|
\(45.6\) |
\(-10.7\) |
|
\(11.6\) |
\(9.6\) |
|
\(18.6\) |
\(2.4\) |
|
\(12.1\) |
\(21.8\) |
|
\(30.5\) |
\(7.2\) |
|
\(10.0\) |
||
Mean |
\(19.82\) |
\(3.90\) |
SD |
\(14.72\) |
\(12.17\) |
In section, you looked at differences in reaction times between |
||
subjects who were sleep deprived and subjects who were not. |
Test the hypothesis of no difference between the two groups, using the normal distribution to approximate the \(P\)-value.
