Discussion 8: Randomized Controlled Trials#
STATS 60 / STATS 160 / PSYCH 10
Show and Tell: Correlation vs. Causation#
The discussion assignment for the week was to locate a recent example of an article or other media piece which describes a correlation, and then assumes (without further evidence) that correlation implies causation.
Upload a screenshot and description of the example.
Come up with a plausible alternative non-causal explanation for the observed correlation.
Suggest an experiment that could be conducted to determine whether the causal relationship is real. In some cases it is impossible or unethical to do such an experiment; if so, explain what the obstacles are.

Recap: Experimental Design and the Potential Outcomes Model#
Observational trials and other natural experiments:
The treatment and control groups are chosen according to criteria other than randomization
Confounding variables and limitations of observational studies:
Unaccounted for confounding variables could always be present
Causation cannot be inferred
In some cases this is the best option available:
Ethical considerations:
Sometimes treatment is not ethical, but we want to understand its effect (Example: effect of big market shocks on economies)
Sometimes a placebo control is unethical (Example: medication known to save lives, but exact dosage to be determined)
Cost/scale considerations
Randomized Controlled Trials:
The gold standard, if we want to infer a causal relationship between treatment and outcome
The treatment and controlled groups are sampled randomly from the same population
Potential outcomes model
Each individual \(i\) has two “potential outcomes”:
\(Y_i(0)\) is the response to control
\(Y_i(1)\) is the response to treatment
We observe only one of them, depending on whether \(i\) received treatment or control
Simulation allows us to compute \(p\)-values for differences in outcomes
Similar to the permutation test for correlation
Research Question#
Does sleep deprivation hinder learning?
How would you design a study to answer this question?
Randomize subjects to two groups.
One group is deprived of sleep, the other sleeps normally.
Compare their performance on some cognitive task.
Study of Sleep Deprivation#
Stickgold, James, and Hobson (2000) conducted such a study.
They randomized 21 subjects, aged 18-25 years, to two groups.
A treatment group of 11 subjects was deprived of sleep for 30 hours.
A control group of 10 subjects was allowed to sleep normally.
They measured them on the following cognitive task.
#
First, subjects looked at this image.
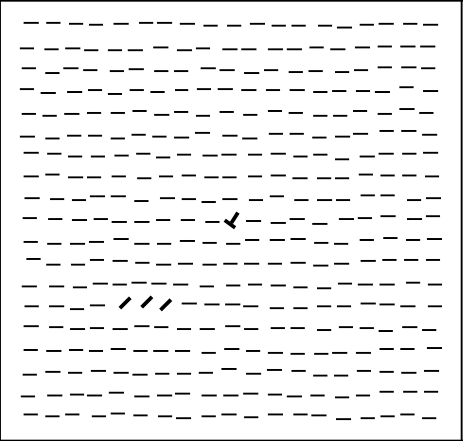
#
Then, they replaced the image with a “mask” and asked about the previous image.
 Question 1. What letter was in the middle of the screen?
a. T b. L
Question 2. There were three diagonal bars. How were they arranged?
a. horizontally b. vertically
Measuring Outcomes#
Subjects did this task the day before and 3 days after the sleep deprivation.
The outcome for each subject was the improvement in reaction times (in milliseconds).
For example, a subject who took 5 ms at the beginning of the study and 2 ms at the end had an improvement of 3 ms.
Data#
Here were the outcomes (in milliseconds) for the 21 subjects.
Control |
Sleep Deprivation |
|---|---|
25.2 |
-10.7 |
14.5 |
4.5 |
-7.0 |
2.2 |
12.6 |
21.3 |
34.5 |
-14.7 |
45.6 |
-10.7 |
11.6 |
9.6 |
18.6 |
2.4 |
12.1 |
21.8 |
30.5 |
7.2 |
10.0 |
What are the null and alternative hypotheses?
\(H_0\): Sleep deprivation has no effect on performance.
\(H_A\): Sleep deprivation decreases performance.
On the handout, set up the potential outcomes table under the null hypothesis.
Use the applet to simulate the distribution of the difference in means under the null hypothesis.