Discussion 5: Fundamental Summary Statistics#
STATS 60 / STATS 160 / PSYCH 10
Means and medians without variability#
The discussion assignment for the week was to find an example of a piece of media that reported a statistic of central tendency (a mean or a median) without any mention of variability.
Why should the variability be included in this example? Could the reader be misled is the variability is large?
Were you able to find a measurement of variability in the data or elsewhere?
Does knowing the variability change your conclusions about the example?

Data visualization and summary statistics#
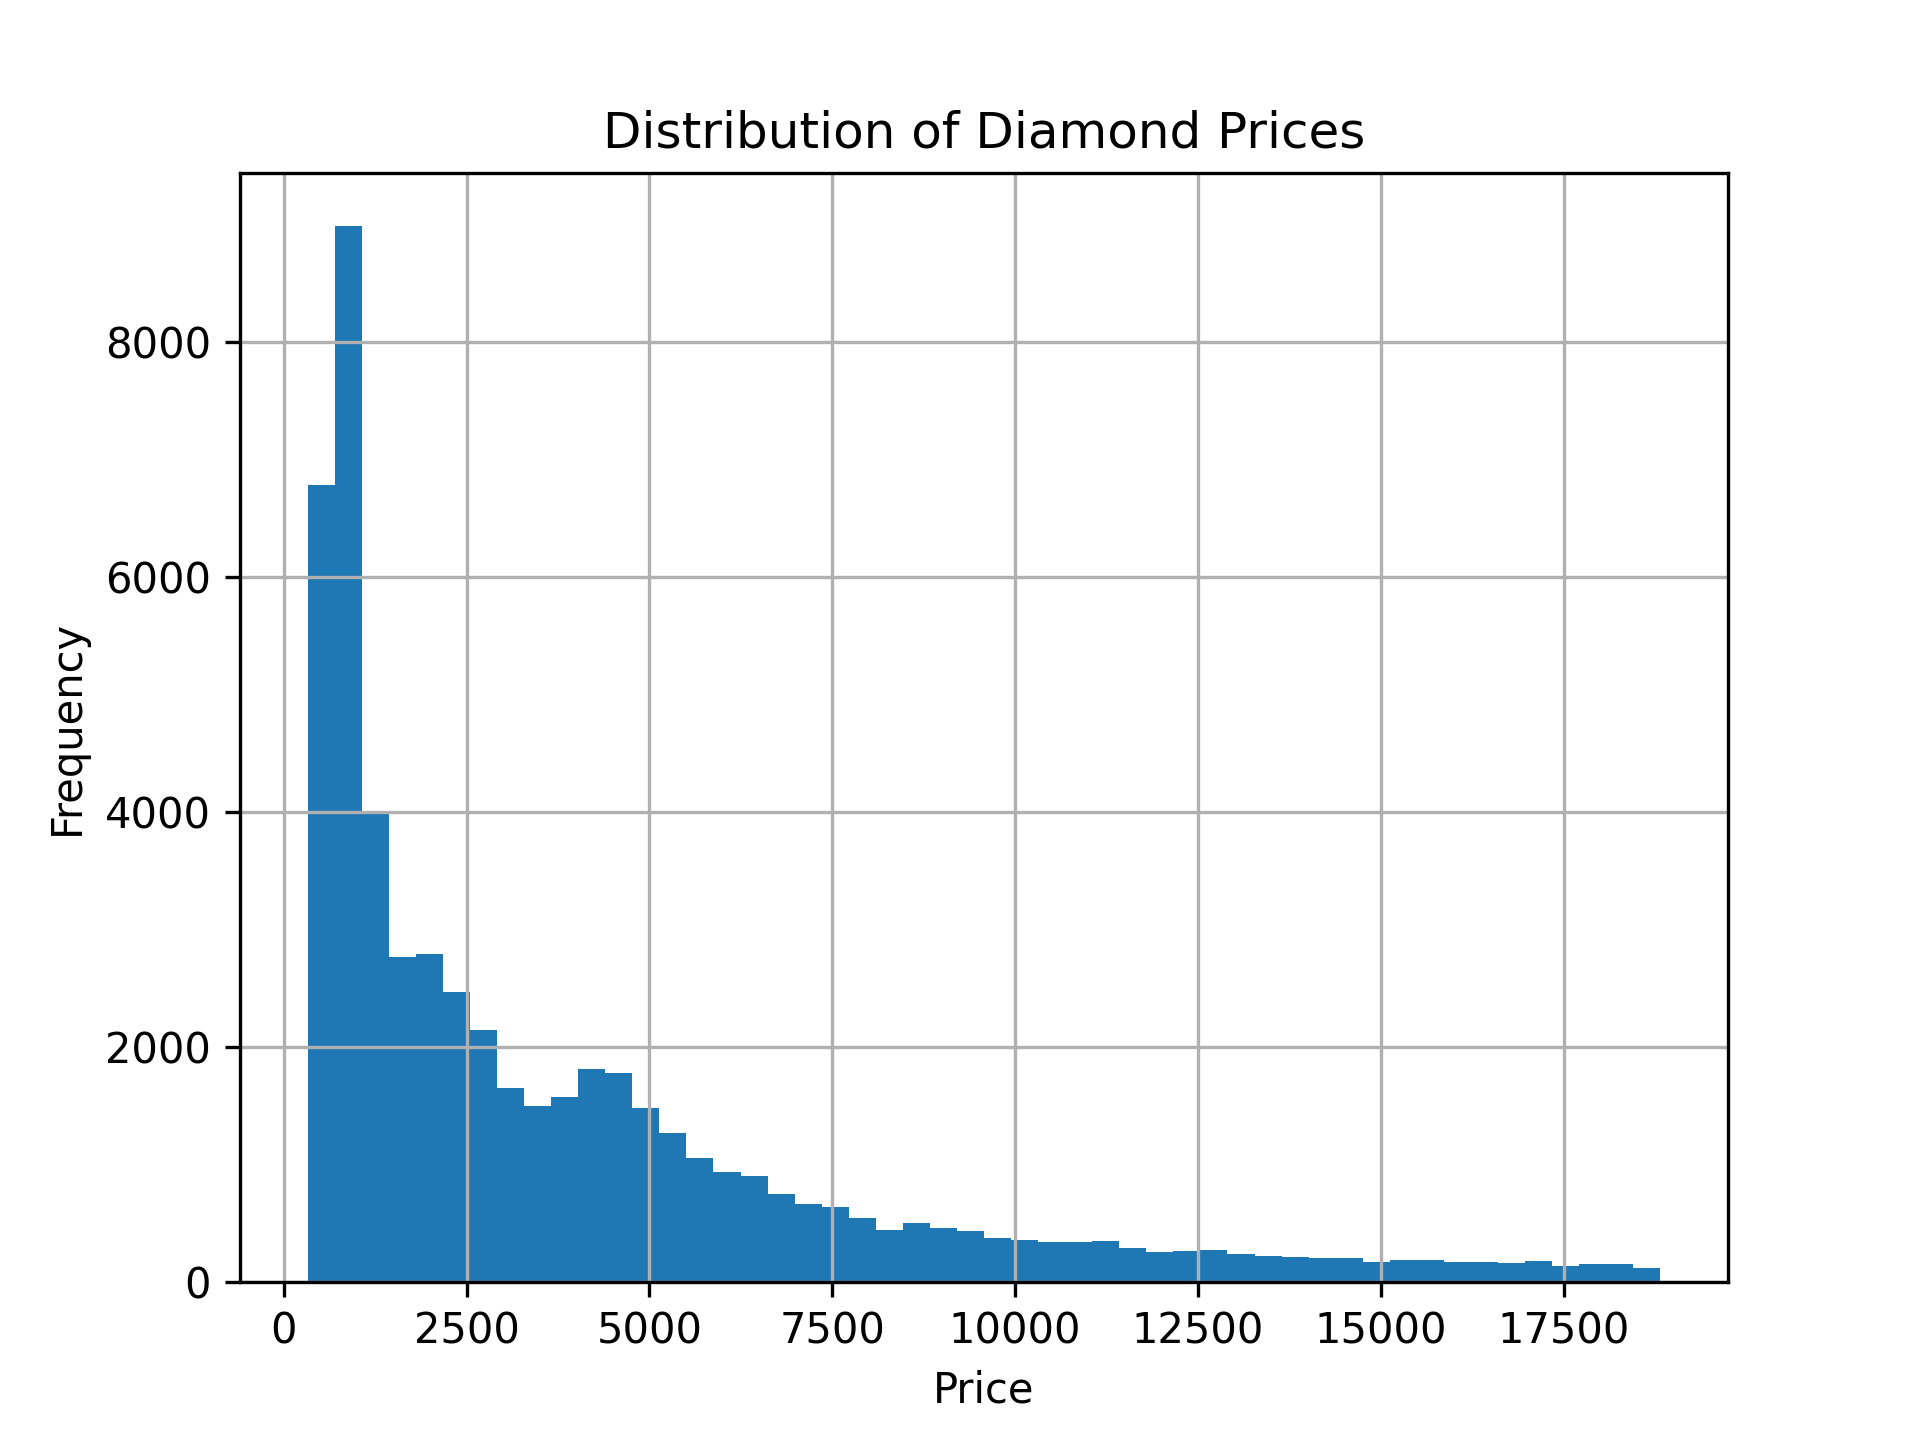
Histograms are used to show the distribution of a numeric variable such as price.
From a histogram, you should be able to roughly work out three things:
The center (the mean and the median)
The variability
The shape (symmetric or skewed, multiple peaks, outliers)
Data visualization and summary statistics#
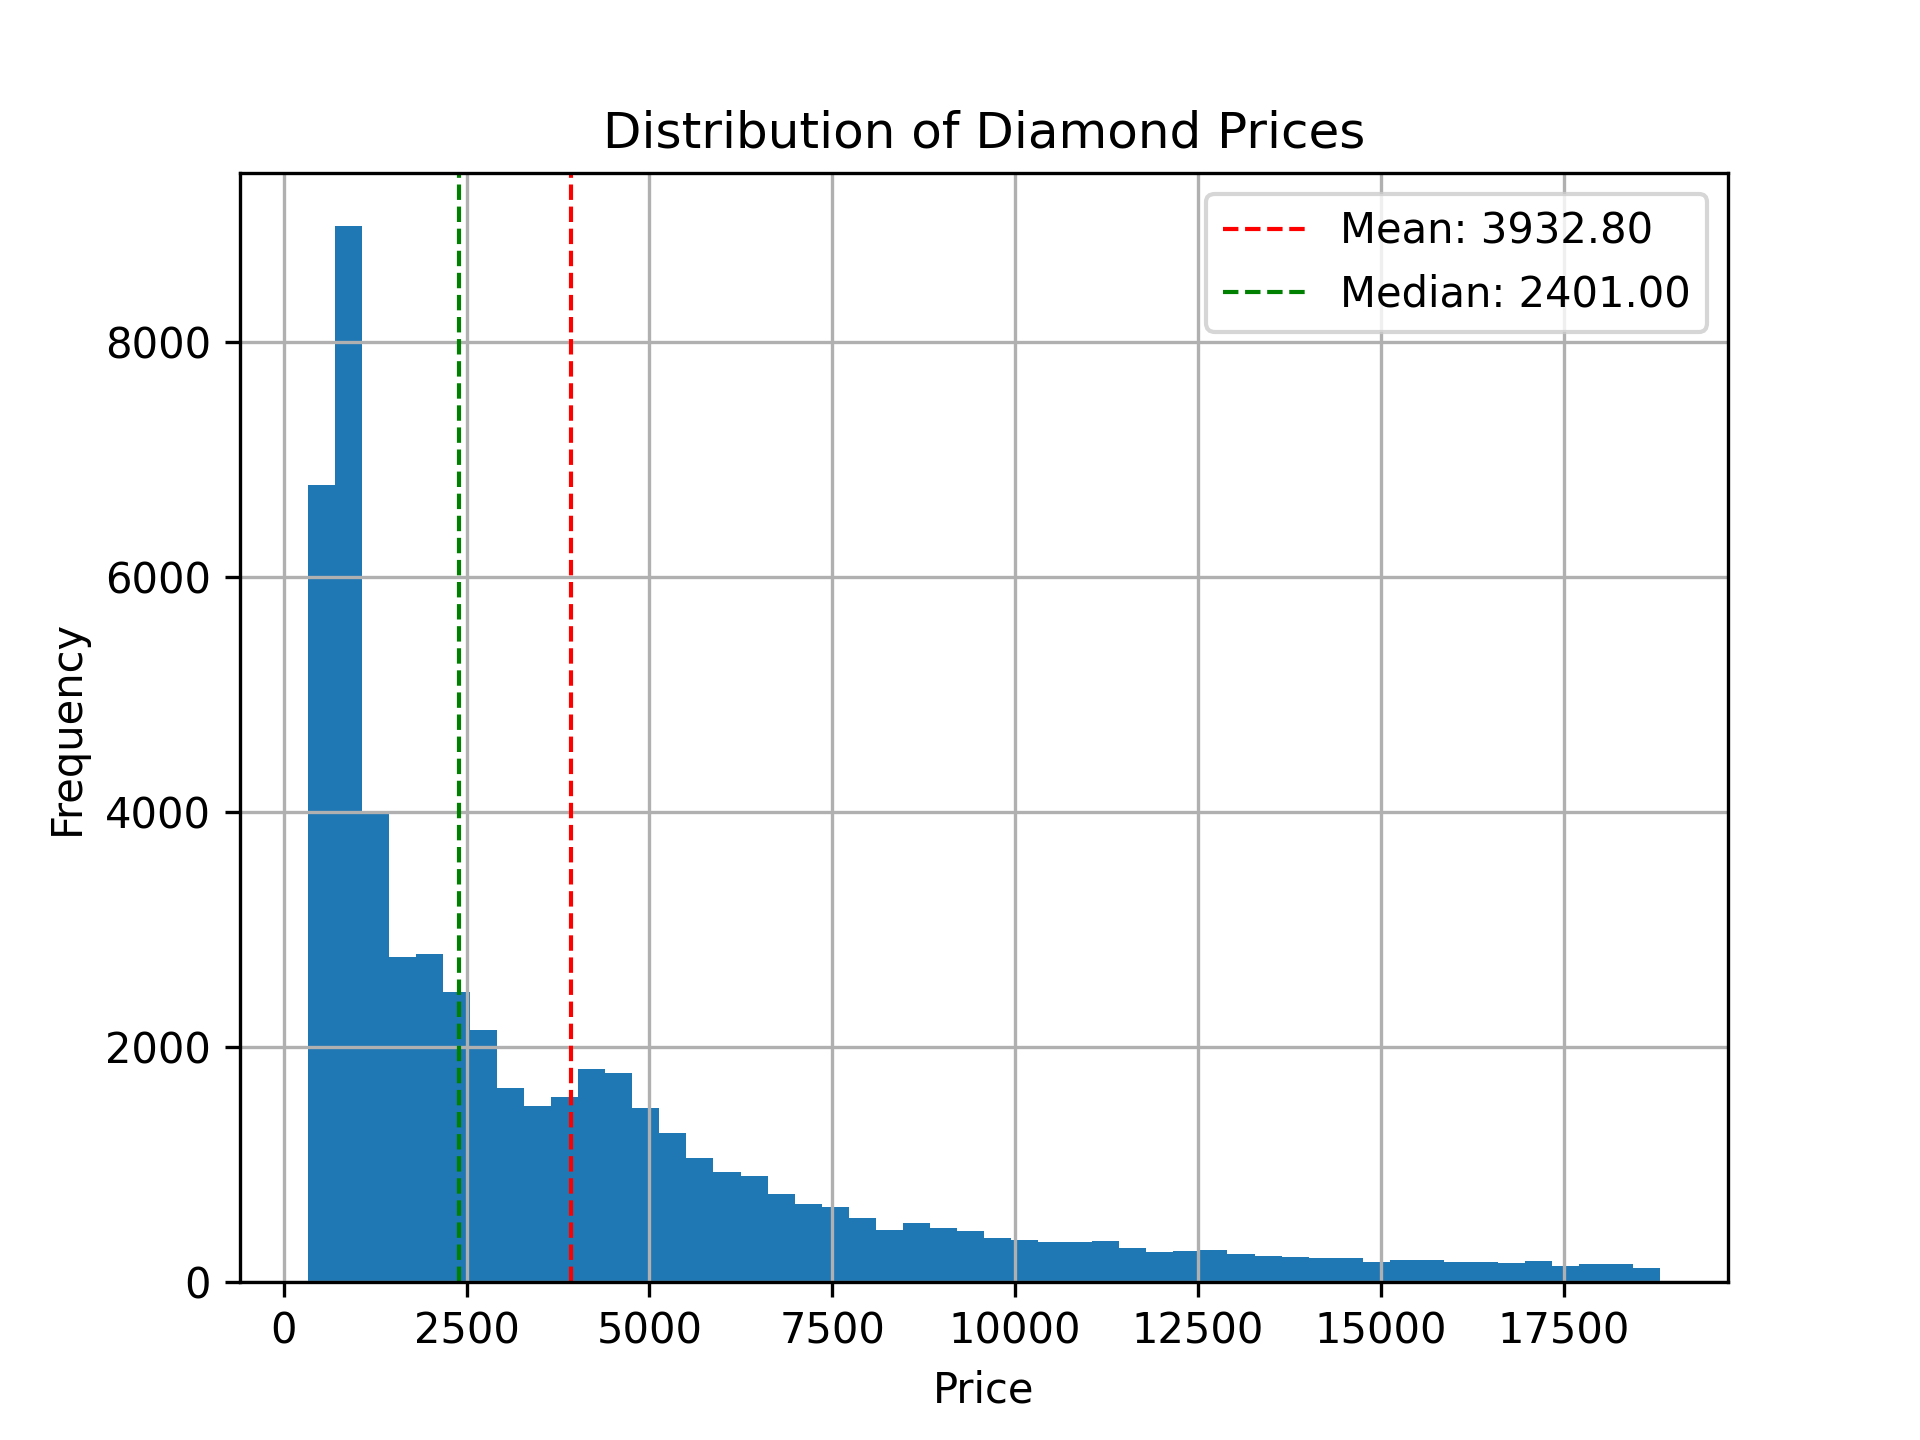
Where (roughly) is the center?
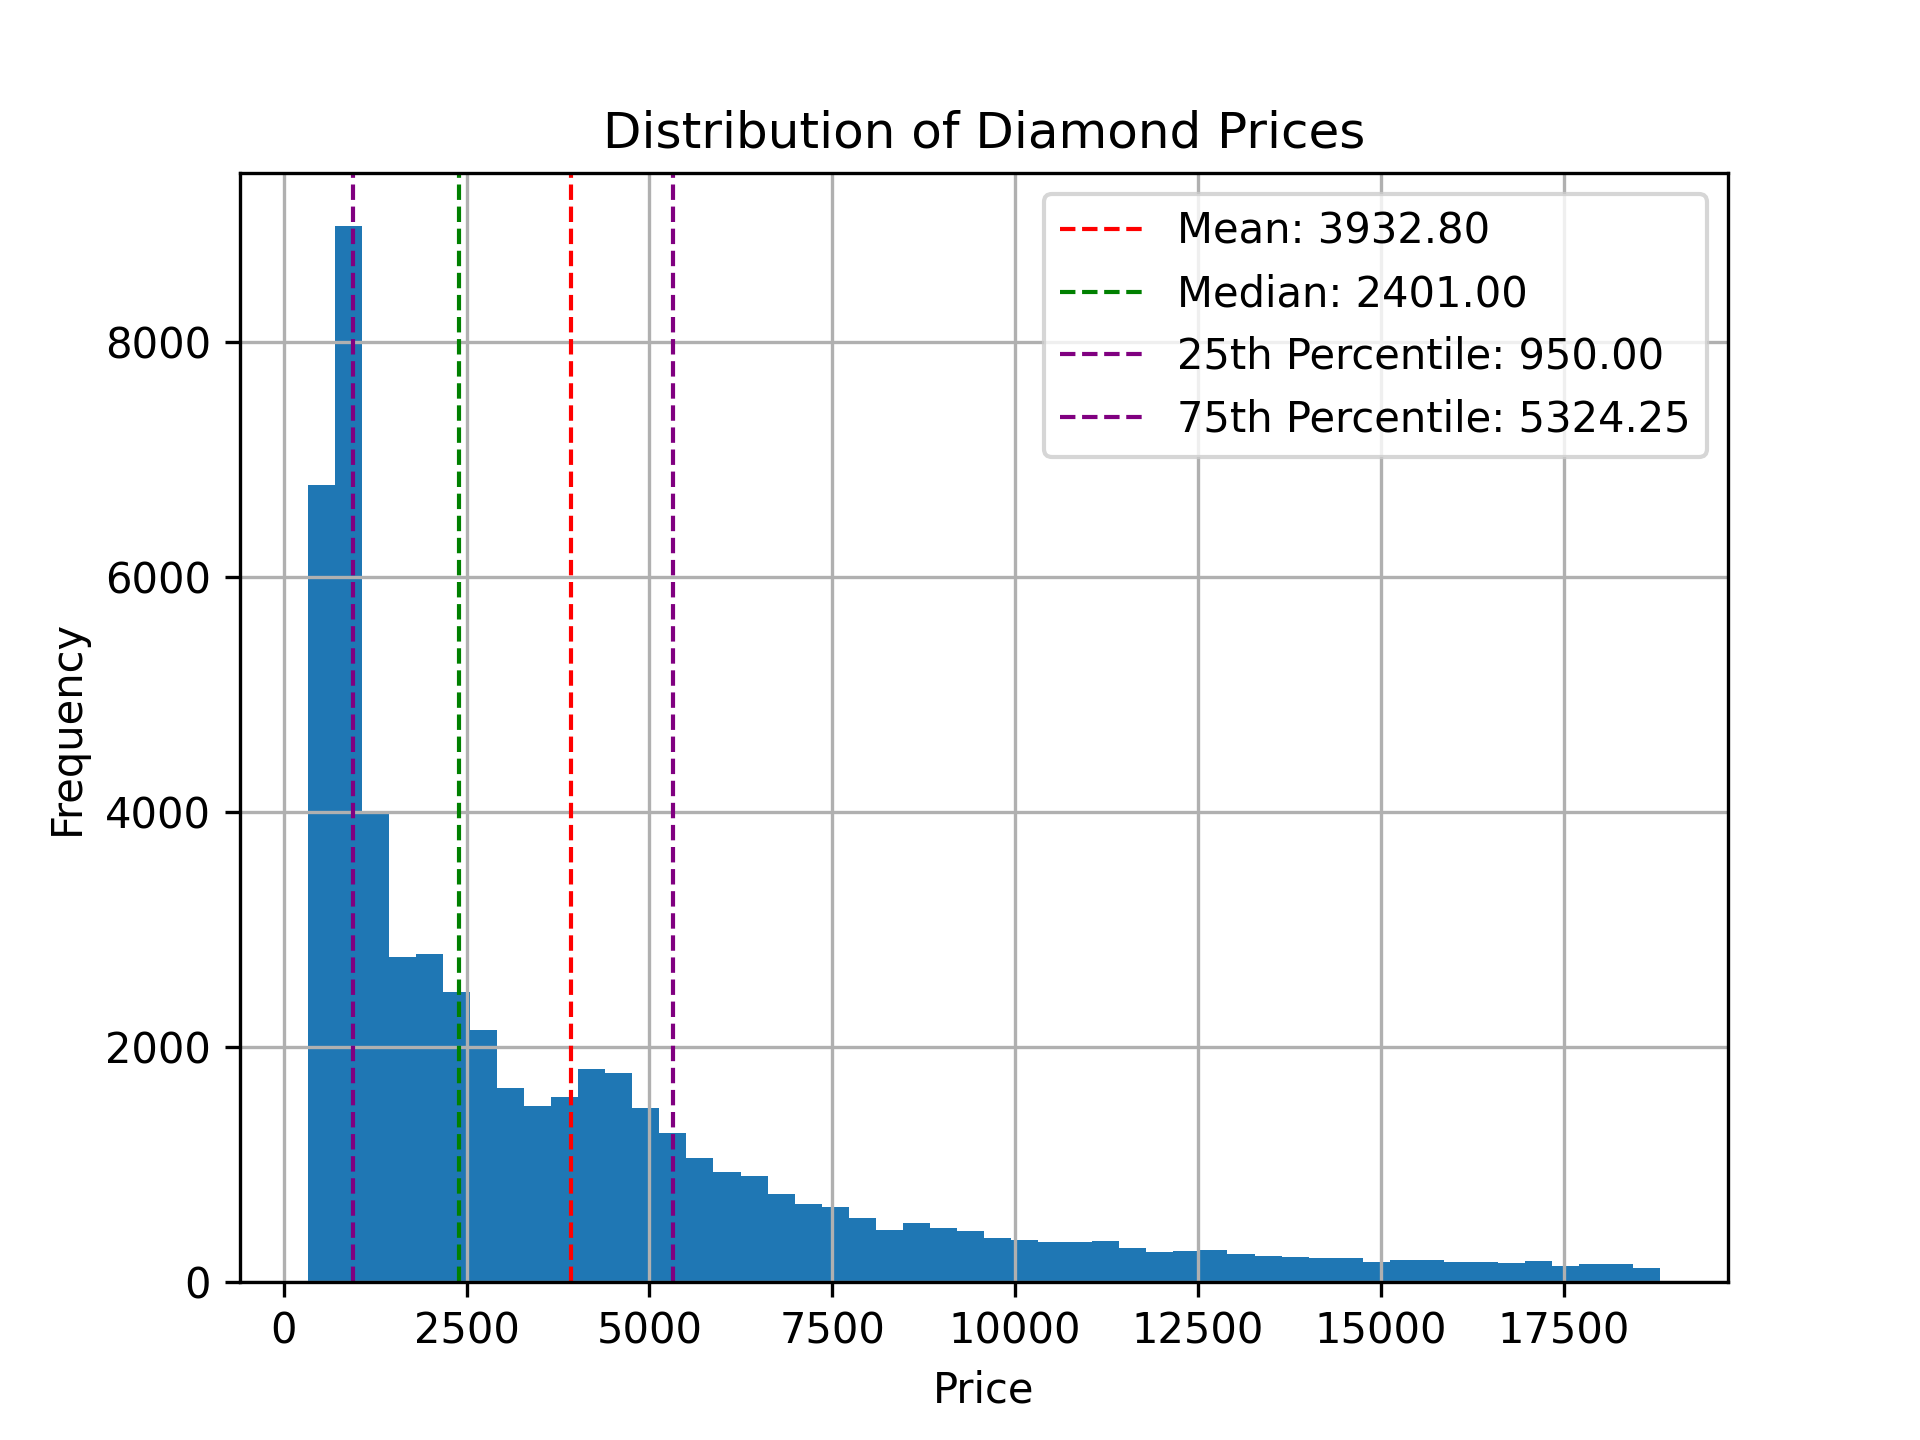
What range includes most of the points in the dataset?
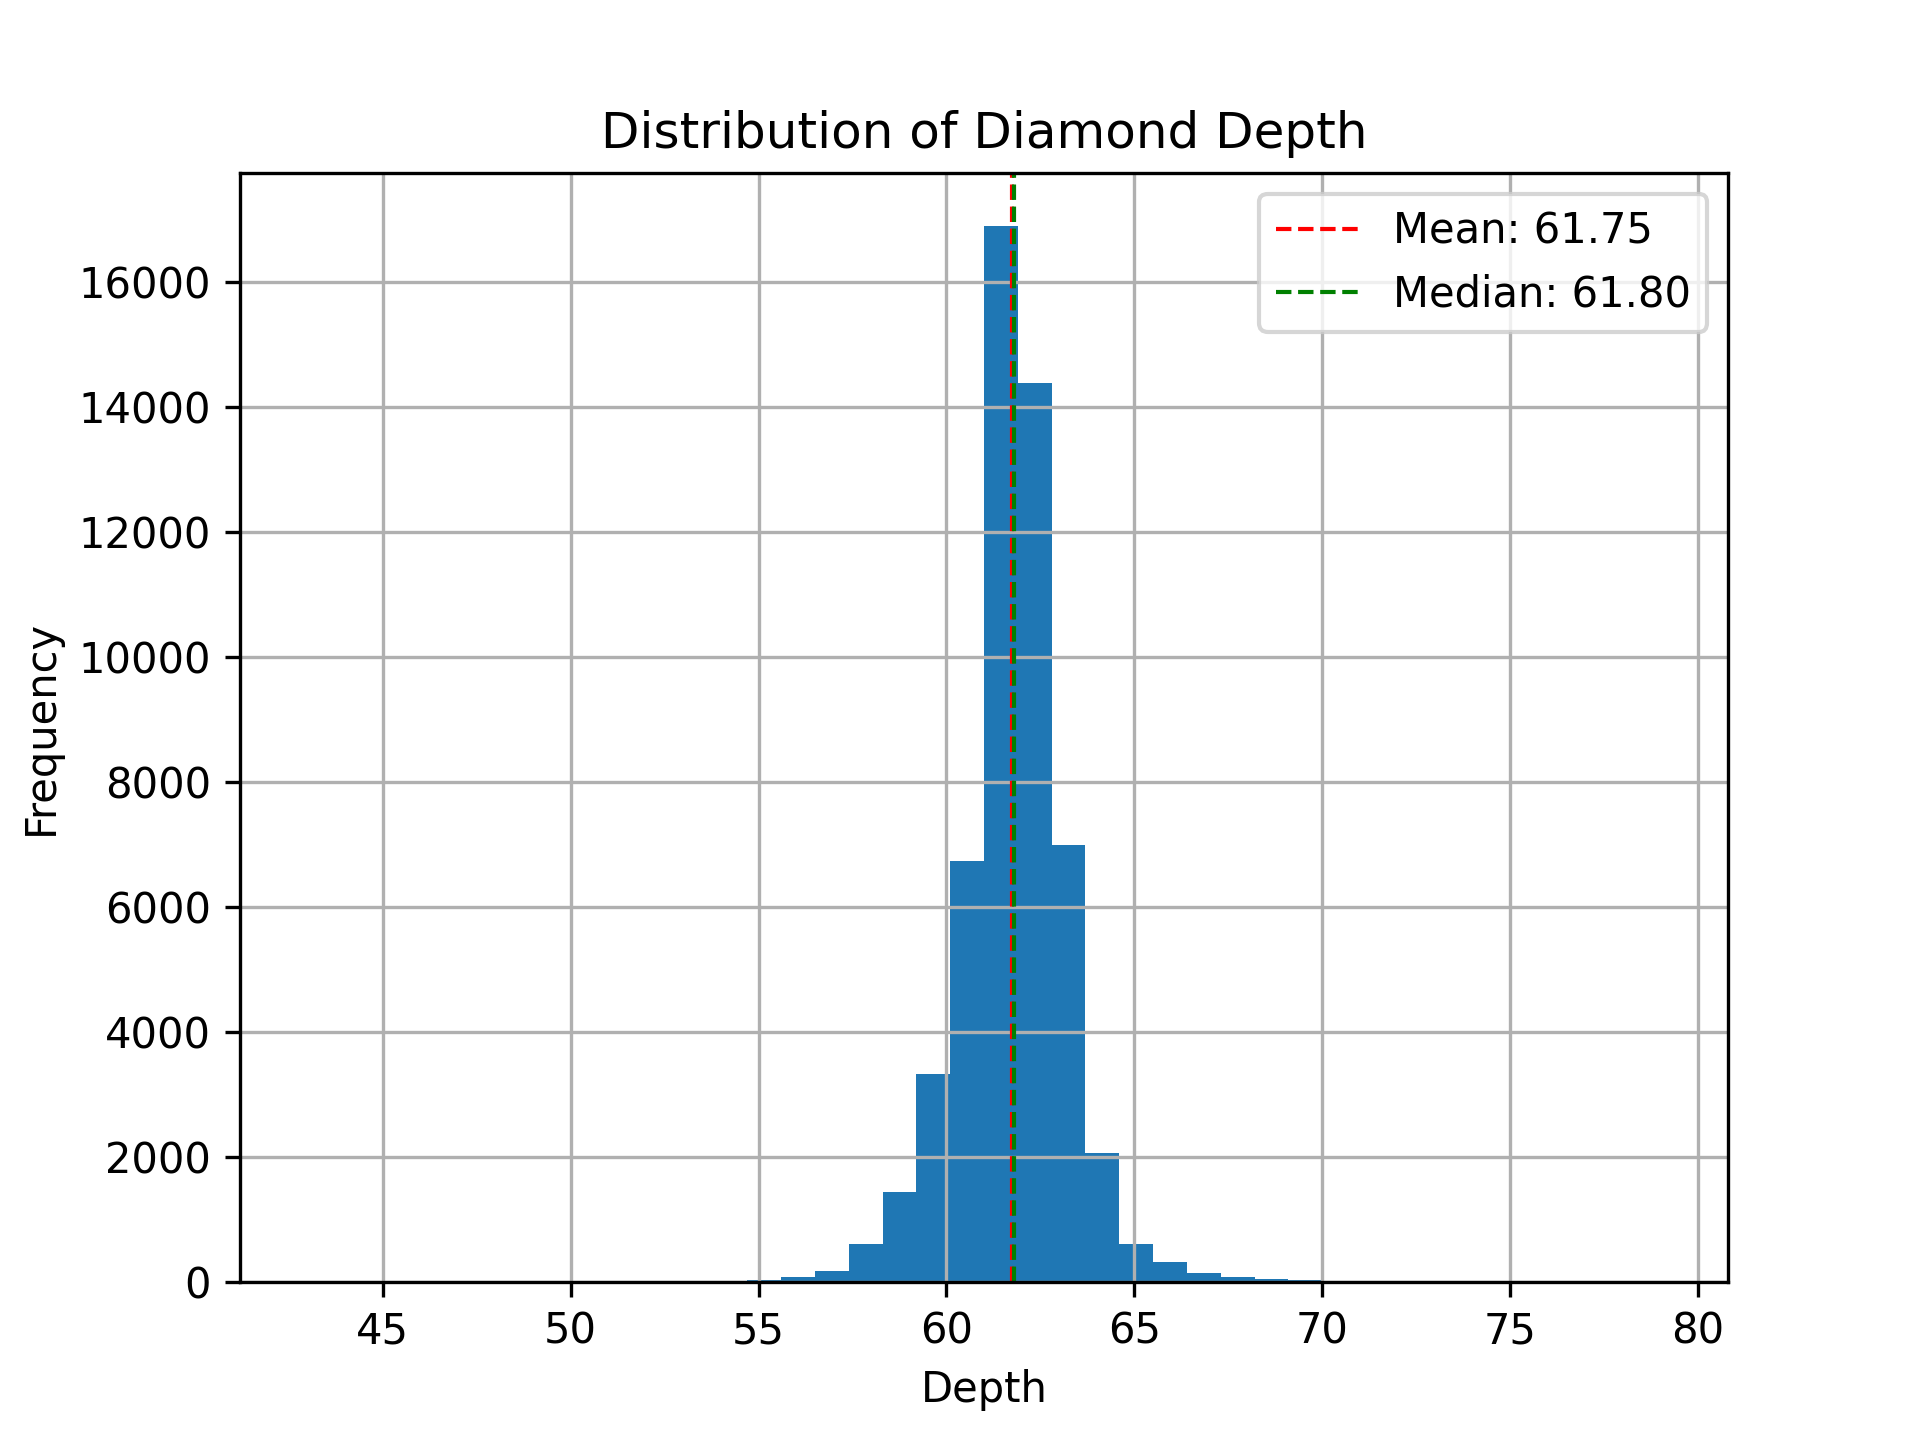
Is the dataset symmetric or skewed? Are there multiple modes or outliers?
Center of the data#
Variability#
Shape#
Shape 2#
Data visualization with AI#
The webpage of today’s discussion has a link to a colab notebook.
We will go through the first example together, then you can work in pairs on the remaining example.
For each of the plots, think about the three questions: center, variability and shape.