Lecture 19: Hypothesis testing#
STATS 60 / STATS 160 / PSYCH 10
Concepts and Learning Goals:
Hypothesis testing
Null hypothesis
p-values & statistical significance
Alternative hypothesis
Type 1 and type 2 errors
AI or Not?#
For each of the 8 images below, decide: is it AI-generated, or a photograph?

AI or Not?#
For each of the 8 images below, decide: is it AI-generated, or a photograph?

AI or Not?#
For each of the 8 images below, decide: is it AI-generated, or a photograph?

AI or Not?#
For each of the 8 images below, decide: is it AI-generated, or a photograph?

AI or Not?#
For each of the 8 images below, decide: is it AI-generated, or a photograph?

AI or Not?#
For each of the 8 images below, decide: is it AI-generated, or a photograph?

AI or Not?#
For each of the 8 images below, decide: is it AI-generated, or a photograph?

AI or Not?#
For each of the 8 images below, decide: is it AI-generated, or a photograph?

Which were AI generated?#
Image 1: Not AI
Image 2: Not AI
Image 3: Not AI
Image 4: AI
Image 5: AI
Image 6: Not AI
Image 7: AI
Image 8: AI
How many did you get right?#
I asked my boyfriend Tynan, and he got 7 out of 8 right.
If someone is just guessing randomly, what is the probability that they got **7** or more correct?A lucky guess?#
Data: Tynan classified 7 of 8 images correctly.
But maybe Tynan was just lucky. How can we distinguish whether the 7/8 correct is a signal or just noise?
We use the hypothesis testing framework:
Assume it’s just noise. (This is called the null hypothesis.)
Under this assumption, calculate the probability of observing the data or a more extreme result.
If this probability, called the \(p\)-value, is “small” (often, we use the criterion < 5%), then we reject the null hypothesis and say the trend is statistically significant.
#
Assume it’s just noise.
Null Hypothesis: Tynan was just guessing.
Under this assumption, calculate the probability of observing the data or a more extreme result.
If Tynan is just guessing, what is the probability of guessing 7 or more correct?
Remember from the probability unit:
Model each random guess as a fair coin toss.
We want to know the probability that \(7\) or more tosses resulted in Heads.
The probability of getting exactly \(k\) out of \(8\) heads is $\(\binom{8}{k}\left(\frac{1}{2}\right)^{8}.\)$
Add this up over \(k = 7,8\):
import math
sum([math.comb(8,k) * (1/2)**(8) for k in [7,8]])
0.03515625
If this probability, called the \(p\)-value, is “small” (often, we use the criterion < 5%), then we reject the null hypothesis.
Because the \(p\)-value is 0.035, which is less than 0.05, we reject the null hypothesis and conclude that Tynan can tell AI generated images from real ones better than a random guess.
Your \(p\)-value#
What is your \(p\)-value (the chance of your outcome if you were just randomly guessing)?
for t in range(9):
    print("p-value for >=",t," correct is ", sum([math.comb(8,k) * (1/2)**(8) for k in range(t,9)]))
p-value for >= 0  correct is  1.0
p-value for >= 1  correct is  0.99609375
p-value for >= 2  correct is  0.96484375
p-value for >= 3  correct is  0.85546875
p-value for >= 4  correct is  0.63671875
p-value for >= 5  correct is  0.36328125
p-value for >= 6  correct is  0.14453125
p-value for >= 7  correct is  0.03515625
p-value for >= 8  correct is  0.00390625
Hypothesis testing#
We do an experiment, and we want to evaluate whether the outcome is a signal or just noise.
The hypothesis testing framework gives us the following recipe for doing so:
State the Null Hypothesis: the data we observed was “just random noise”
Assuming the null hypothesis is true, calculate the probability we observed our data.
This probability is called the \(p\)-value
The \(p\)-value is just “the probability we would see this data if it were just random noise”
If the \(p\) value is small, we reject the null hypothesis, which means we think it is unlikely the data we observed is just random noise.
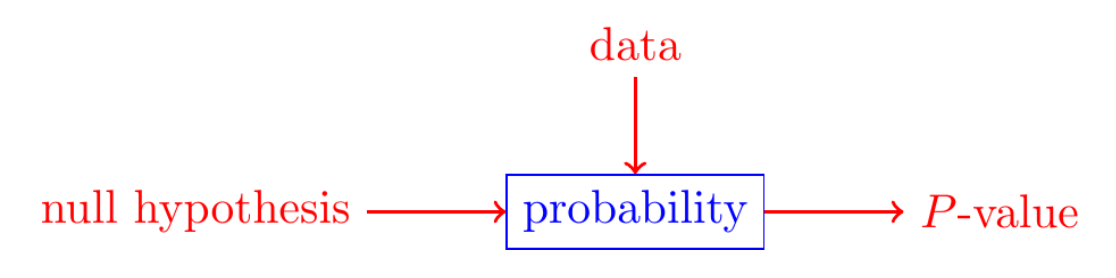
Probability \(\to\) statistics#
Hypothesis testing (statistics) is a way of interpreting probability in the context of data analysis.
What does rejecting the null mean?#
We rejected the null hypothesis.
Question: Are we certain that the null hypothesis was false?
No! All we know is that the data we observed is not very likely under the null hypothesis.
If we were to re-run this experiment and the null hypothesis is true, we would observe our data (or a more extreme outcome) \(<5\%\) of the time.
Testing for discrimination#
My friend B is the technical lead of a machine learning team at a large Slicon Valley tech company.
His team is made up of 9 engineers, and 0 of them grew up in North America.
Do you think B’s team’s hiring practice is discriminatory against North Americans?
The base rate: only 20% of the qualified applicant pool is from North-America.
Question: Let’s formulate this as a hypothesis testing problem:
What is the null hypothesis?
What is the \(p\)-value of our data, given the null hypothesis? (Write down a formula to calculate it.)
Should we reject the null hypothesis?
#
B’s has 9 engineers, and 0 of them grew up in North America. \(20\%\) of the qualified applicant pool is North-American born.
Is B’s team hiring practice discriminatory against North Americans?
What is the null hypothesis?
No discrimination against North Americans:
Each person hired independently has probability \(.2\) of being North American (the base rate in the qualified applicant pool)
What is the \(p\)-value of our data or a more extreme outcome, given the null hypothesis?
The \(p\)-value is the probability (under the null hypothesis) of having 0 North-Americans out of \(9\) hired
This is the same as the probability of flipping a coin with heads probability \(0.2\) a total of \(9\) times, and seeing no heads.
The probability is \(\binom{9}{0}\cdot(1-.2)^9 \approx 0.13\).
Should we reject the null hypothesis?
In this case, our \(p\)-value is \(0.13 > .05\), so we do not reject the null hypothesis.
The lack of North American engineers on B’s team is not statistically significant.
How sensitive is our conclusion to the base rate? What if 30% of the applicant pool were North American?
Hypothesis testing and the Normal Approximation#
During Friday’s lecture, I had each of you choose a random word from the Gettysburg Address.
The sample mean word length was \(6.3\) (sample size \(n=64\)), whereas the population mean was \(4.3\), and the population standard deviation is \(2.2\).
Is this a signal that our sample was nonuniform/biased, or is it noise?
Let’s try to determine whether it is plausible that our sample of words was a uniform sample.
State the null hypothesis:
The class sample was a uniformly random sample of words, with replacement, from the Gettysburg Address.
Assuming the null hypothesis is true, calculate the \(p\)-value (the probability we saw our data):
The \(p\)-value is the probability that our sample mean was at least \(6.3-4.3 = 2\) larger than the population mean.
We’ll use the Normal approximation for the sample mean:
The words in the Gettysburg address are our population, the population mean word length is \(\mu = 4.3\), the population standard deviation is \(\sigma = 2.2\).
The sample size was \(n=64\). So the sample standard deviation was \(\frac{\sigma}{\sqrt{n}} = \frac{2.2}{\sqrt{64}} = .275\).
The difference \(|\mu-\hat\mu_n| = 2\).
This is more than \(7\) standard deviations (\(7 \times .275 \approx 1.93 < 2\)).
The \(68-95-99\) rule then tells us that the \(p\)-value is way less than \(5\%\).
Exact computation:
from scipy.stats import norm
print("p value is ",1 - norm.cdf(2/0.275))
p value is 1.7619239400801234e-13
If the \(p\)-value is small, we reject the null hypothesis.
Our \(p\)-value is \(< 10^{-12}\); we reject the null hypothesis.
That is, we think it is unlikely that our sample was a uniform sample.
Did Dream Cheat?#

Who is Dream?#

Dream is a Minecraft speedrunner.
Minecraft is a videogame.
A speedrunner tries to beat a videogame as quickly as possible.
In October 2020, Dream was accused of cheating at Minecraft speedruns.
The Evidence for Cheating#
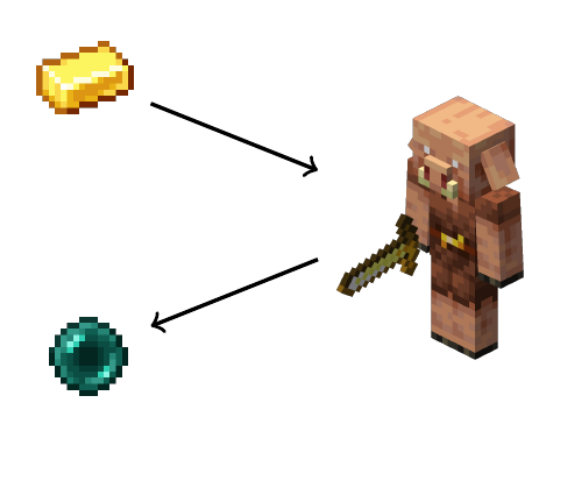
To beat Minecraft, one has to trade gold ingots with a piglin for ender pearls.
But each time you trade, there is only a \(\frac{20}{423} \approx .0473\) probability that the piglin will give you an ender pearl.
In 262 trades with piglins, Dream got ender pearls 42 times.
Do you think Dream cheated?
Testing for Cheating {.smaller .scrollable}#
Null Hypothesis: Dream did not cheat and just got lucky.
Under the null hypothesis, calculate the probability of getting 42 or more ender pearls in 262 trades.
Let’s first try simulating the outcome of 10,000 experiments under the null hypothesis with code:
import numpy as np
import matplotlib.pyplot as plt

samples = np.random.binomial(262,20/423,10000)
plt.hist(samples)
plt.title("Histogram of ender pearl count in 10,000 simulations")
plt.show()
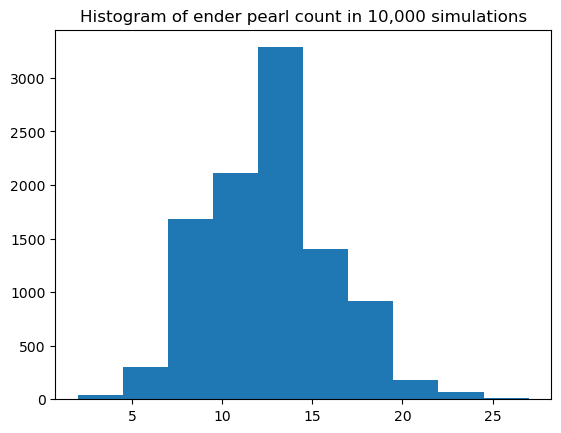
The probability of getting 42 ender pearls is so small that it didn’t even happen once in 10,000 simulations!
Testing for Cheating {.smaller .scrollable}#
Null Hypothesis: Dream did not cheat and just got lucky.
Under the null hypothesis, calculate the probability of getting 42 or more ender pearls in 262 trades.
Let’s calculate the exact probability using the binomial distribution.
1 - sum([math.comb(262,k) * (20/423)**k * (1- 20/423)**(262-k) for k in range(0,42) ])
5.572542427501048e-12
Because the \(p\)-value is essentially \(0\), we reject the null hypothesis and conclude that Dream didn’t just get lucky.
Alternative Hypothesis#
How Did Dream Cheat?#
We rejected the null hypothesis that Dream just got lucky.
But what is our alternative explanation of the data?
Dream was suspected of altering the game to increase the probability that a piglin drops an ender pearl.
So we can write the hypotheses as follows:
Null Hypothesis (\(H_0\)): Dream just got lucky. (\(p = \frac{20}{423}\))
Alternative Hypothesis (\(H_A\)): Dream altered the game to make piglins more likely to drop ender pearls. (\(p > \frac{20}{423}\))
Types of Errors {.smaller}#
| Truth | |||
|---|---|---|---|
| $H_0$ | $H_A$ | ||
| Decision | reject $H_0$ | Type I error | |
| don't reject $H_0$ | Type II error | ||
\(H_0\): Dream just got lucky. (\(p = \frac{20}{423}\))
\(H_A\): Dream cheated. (\(p > \frac{20}{423}\))
What’s a Type I error (False Positive) in the context of the Dream scandal?
falsely accusing Dream of cheating
What’s a Type II error (False Negative)?
letting Dream off even though he really cheated
Calculating Error Rates {.smaller .scrollable}#
\(H_0\): Dream just got lucky.
\(p = \frac{20}{423}\)
\(H_A\): Dream cheated.
\(p > \frac{20}{423}\)
| Truth | |||
|---|---|---|---|
| $H_0$ | $H_A$ | ||
| Decision | reject $H_0$ | Type I Error | |
| don't reject $H_0$ | Type II Error | ||
Suppose we decide to reject \(H_0\) if Dream gets 22 or more ender pearls in 262 trades.
What would the Type I error rate (False positive rate) \(\alpha\) be?
\(\alpha\) is the probability that we reject \(H_0\) when \(H_0\) is true.
p = 20/423
p_21_or_less = sum([math.comb(262,k) * p**k * (1-p)**(262-k) for k in range(0,22)])
1 - p_21_or_less
0.00710292376761168
Calculating Error Rates {.smaller .scrollable}#
\(H_0\): Dream just got lucky.
\(p = \frac{20}{423}\)
\(H_A\): Dream cheated.
\(p > \frac{20}{423}\)
| Truth | |||
|---|---|---|---|
| $H_0$ | $H_A$ | ||
| Decision | reject $H_0$ | Type I Error | |
| don't reject $H_0$ | Type II Error | ||
Suppose we decide to reject \(H_0\) if Dream gets 22 or more ender pearls in 262 trades.
What would the Type II error rate (False negative rate) \(\beta\) be?
\(\beta\) is the probability that we don’t reject \(H_0\) when \(H_A\) is true.
To calculate \(\beta\), we need to decide on a specific value of \(p > \frac{20}{423}\).
For example, for \(p = 0.10\), it would be \(\sum_{k=0}^{21} \binom{262}{k} p^k (1-p)^{262-k}\)
p = 1/10
sum([math.comb(262,k) * p**k * (1-p)**(262-k) for k in range(0,22)])
0.16675242193370396
Aftermath#
Recap#
Hypothesis testing framework:
Use probability to asses the chance that the data we see is just random noise
Null hypothesis: a probabilistic model in which the data is “just random noise”
\(p\)-value: the probability we saw our outcome if the data was just random noise
Alternative hypothesis: the hypothesis that the null hypothesis is false
Type 1 error/False Positive: when our data is random noise, but we think there is a pattern
Type 2 error/False Negative: when there is a pattern, but we think the data is random noise