Lecture 2: Thinking about scale#
STATS60, Stanford University Spring 2025
Announcements:#
Section times and places have been finalized!
Discussion activity is posted online. Deadline is 11:59pm tonight.
Practice quizzes are online.
Student athletes: fill out the google form from the Canvas announcement
Numbers are only meaningful in context.#
Example 1: Is 10,000 people a lot of people?
Answer 1#
Yes, if it’s the number of guests that show up to your house party.
Answer 2#
No, if it’s the total number of people in the world with a given disease.
(e.g. Hyper IgM Syndrome, affecting \(\leq 1\) in a million people. Only \(\approx 300\) people in the whole USA have it.)
Comparisons matter.#
Example 2: Is $10 billion a lot of money?
Answer 1#
Yes, if it is a person’s wealth.
At present Forbes reports fewer than 300 $10-billionaires worldwide, which is less than a tenth of a millionth of a percent of the global population.

Answer 2#
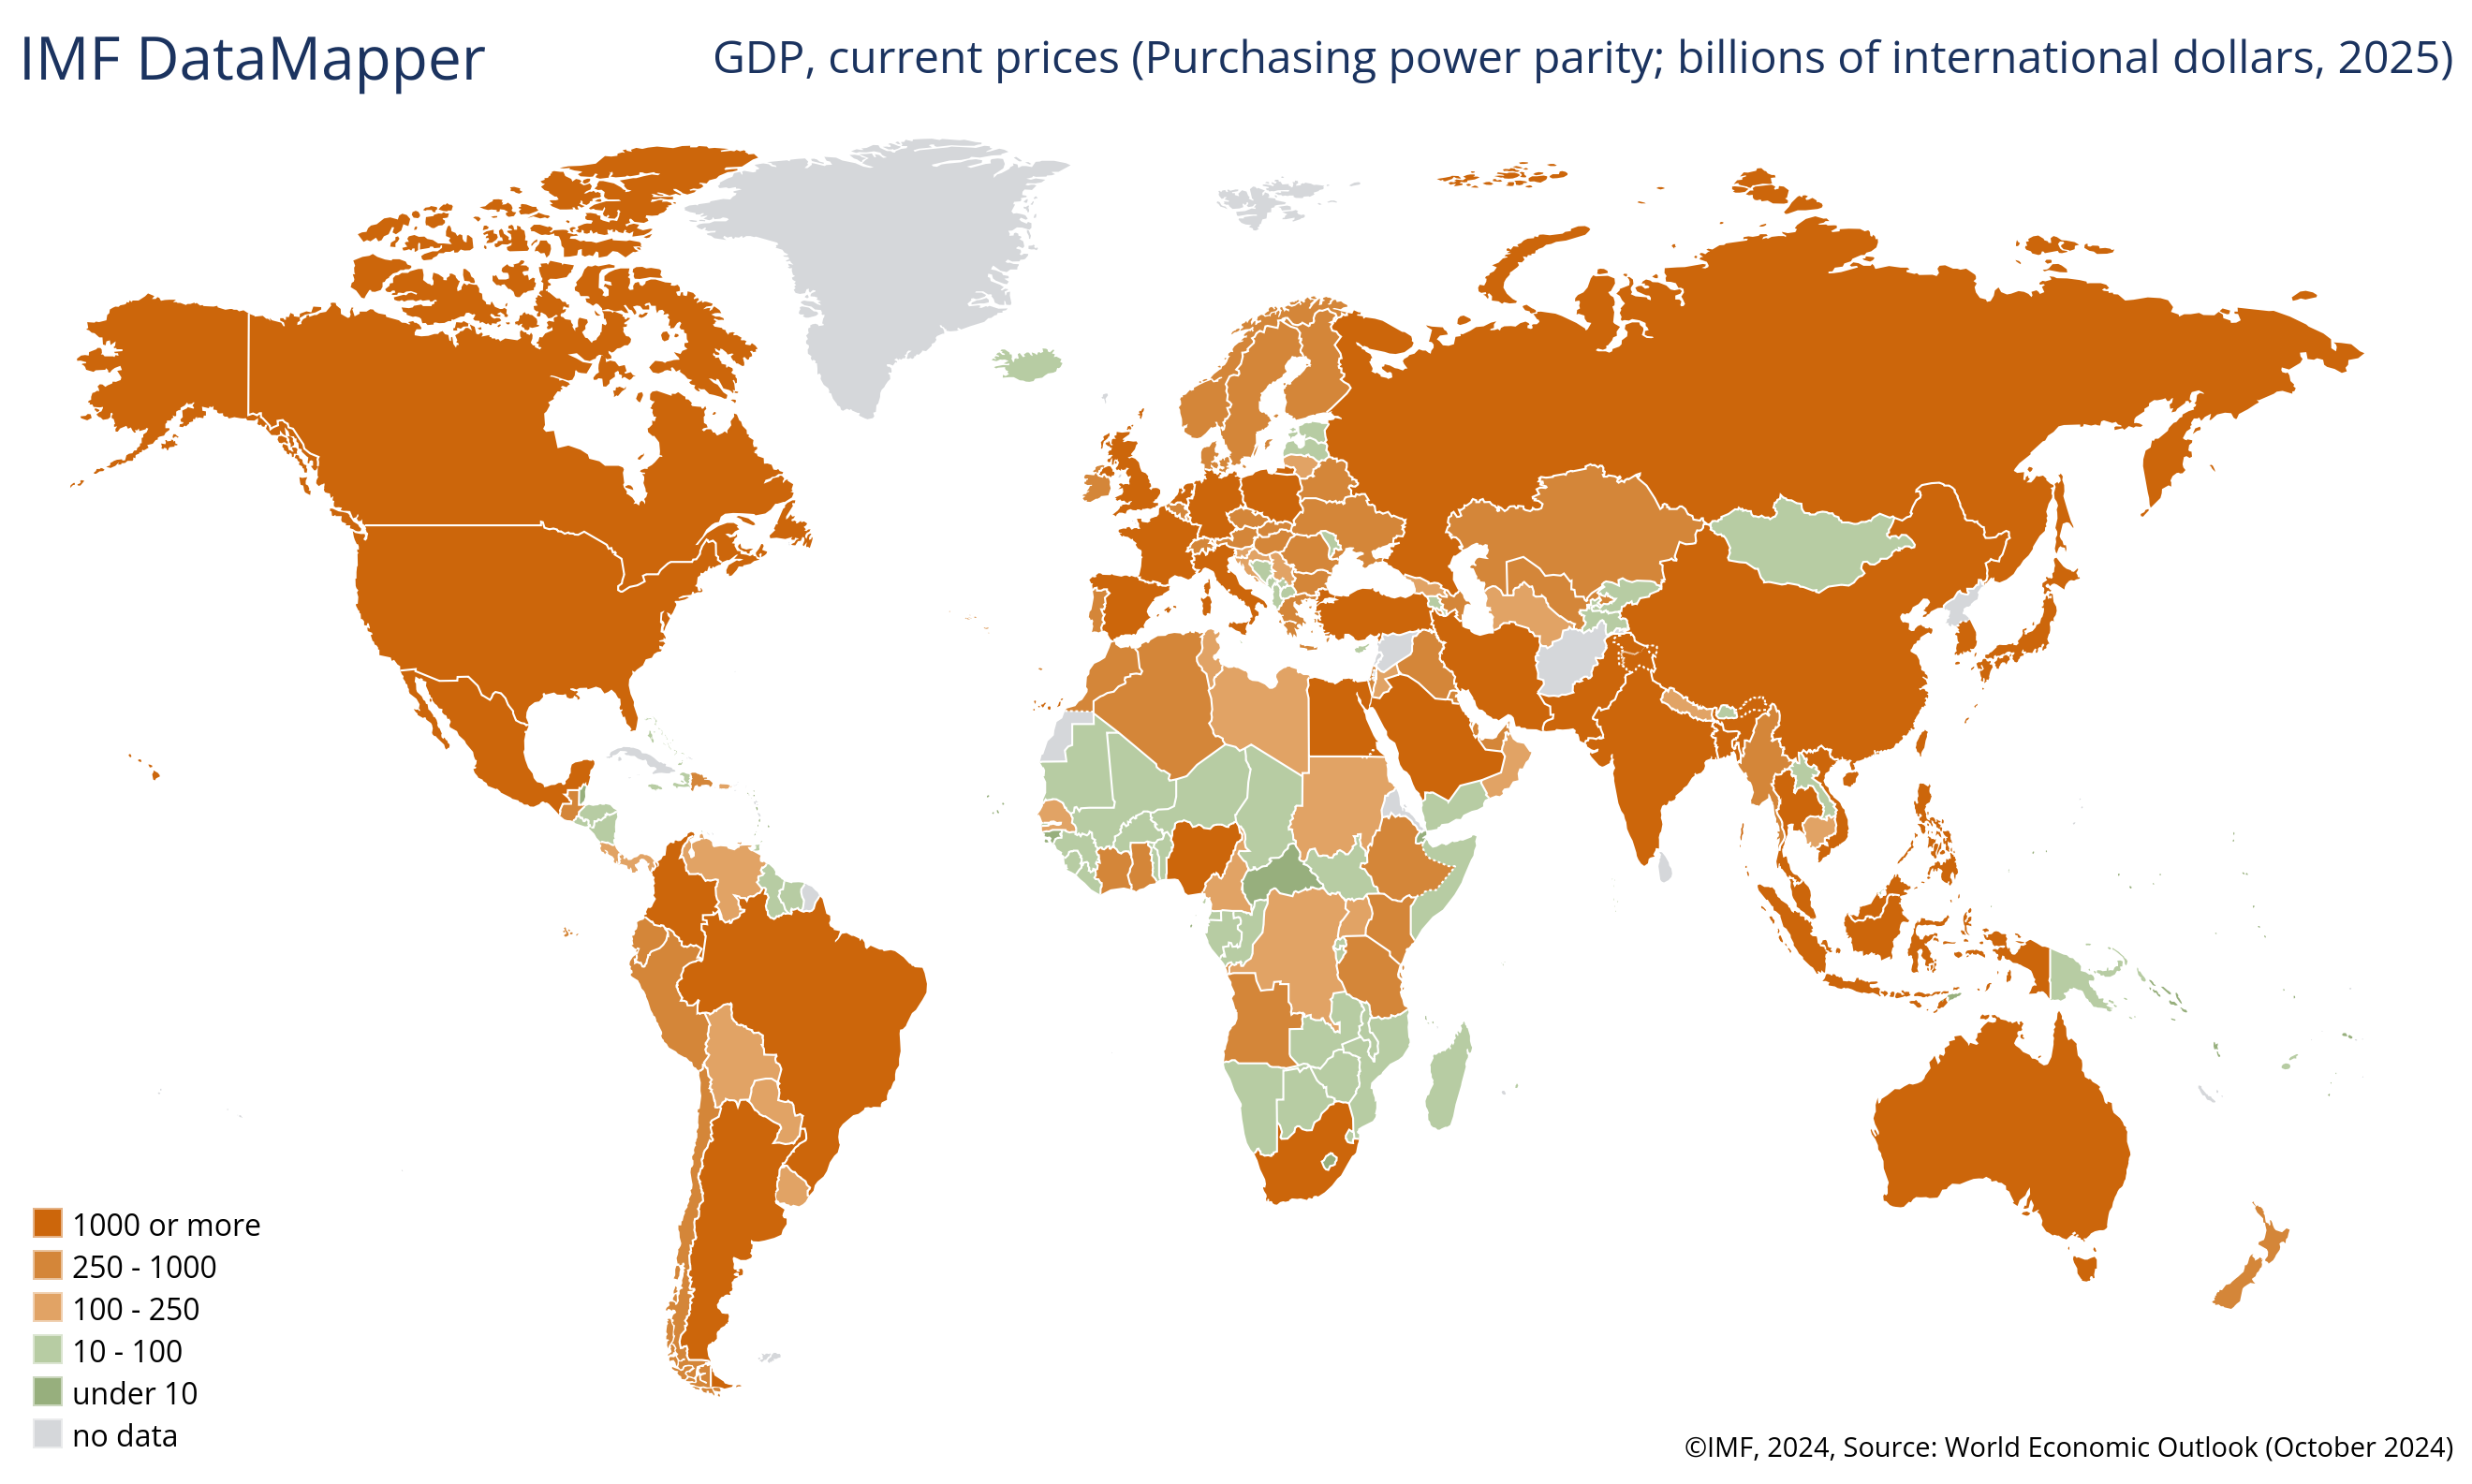
No, if it is the GDP of a country. (Source: IMF)
Insufficient context in the news#
Headlines (and news articles) often contain numbers; sometimes there is context, sometimes not.
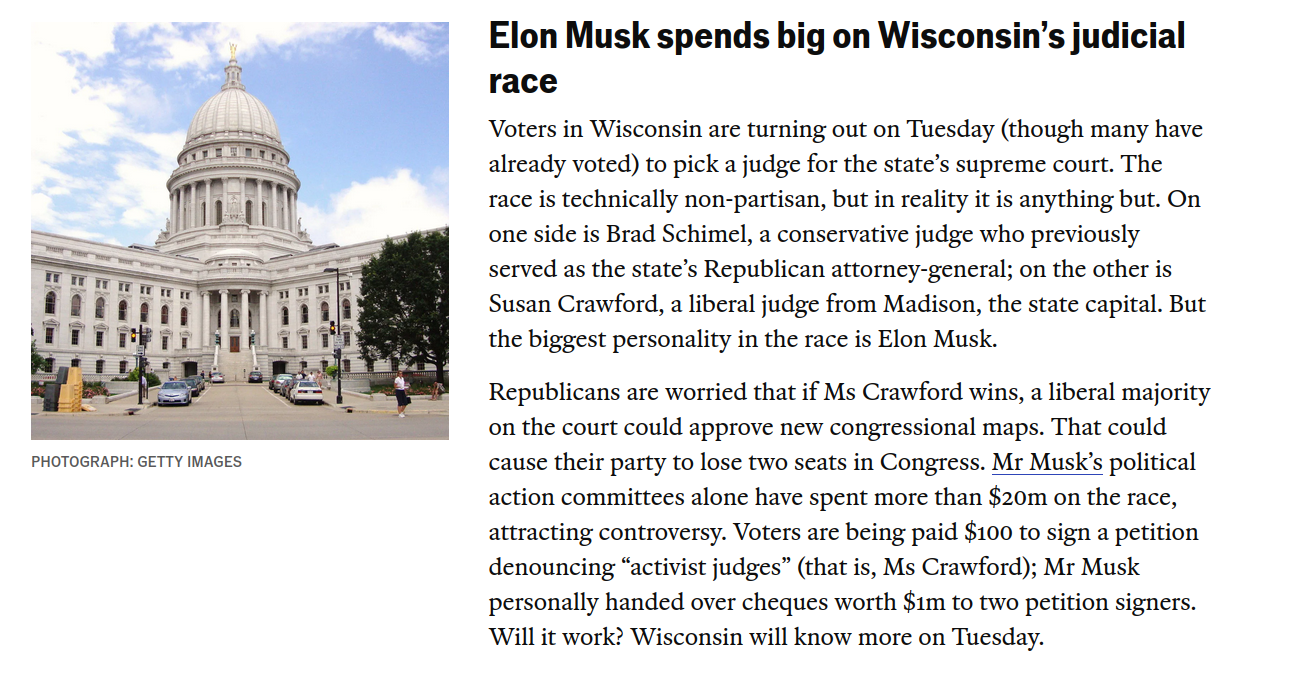
![]()


The same phenomenon (only worse) occurs in advertisements, fundraising, etc.
Putting numbers in context: three questions to ask#
Three questions to ask when you encounter a number:
What type of number is this?
Is it an average? A percentage? A rate?
Would it be helpful to convert it to a different type of quantity?
How was this number calculated?
Who is reporting it?
What can I compare this number to? Is it large or small compared to other similar values?
Can I compare it to the past? Is there a natural “denominator”? What missing information would be helpful for the comparison?
What would I have expected this number to be?
Is the number surprising? Does it seem plausible?
Practice contextualizing#
Example 1: Student Loans#
“The average federal student loan debt balance is $38,375.” Source: Education Data Initiative
(1) What type of number is it?
This number is an average.

When we see an average, we think:
- "is this average representative of the whole population?"
- "what are the extremes?"

    | State | Average Borrower Debt |
    | --- | --- |
    | Maryland | $ 43,692 |
    | California | $ 38,168 |
    | North Dakota | $ 29,279 |

    [Source: Education Data Initiative](https://educationdata.org/student-loan-debt-by-state)

Both of these questions are actually questions about *variability*, a concept which we will formalize later.

(a) How was it calculated?

    - Does this include medical school debt?
    - Is the average over borrowers, or the population as a whole?
    - Does the average include *all* borrowers? What about recent graduates?

(b) Where did the data come from?
    - Is this based on a poll (worry: sample bias), government records, university records, ... ?
    - In this case, it is government records.
(2) What can I compare this number to?
(a) Is this number large or small compared to other similar values? Is there a natural "denominator"?
    - What else can $38,000 buy?
    - How does $38,000 compare to average post-graduation salary?
    - How does the monthly interest payment compare to average borrower salary?
    - What is the return on investment?

(b) What missing information would help us make the comparison?
    - Average salary
    - Cost of a degree
    - Interest rate on loans
    - Average salary in jobs without a degree
What would I have expected this number to be?
Is the number surprising? Does it seem plausible?
Example 2: Car crashes#
In 2022, there were 42,514 fatalities due to car accidents in the United States. National Highway Traffic Safety Administration
(1) What type of number is it?
- This is a count.

- It might be more informative as a rate or a percentage:

    | Ratio | value in 2024 |
    |-----|-----|
    | deaths / mile | 1 in 100,000, or $10^{-5}$ |
    | deaths / hour | ? |
    | deaths / population | ~13 in 100,000, or $1.3 \times 10^{-4}$ |
    | deaths / driver | ~ 18 in 100,000 |

(a) How was it calculated?
    - This number is based on government records.
    - We might worry that the number of accidents is under-reported.
    - On the other hand, fatalities are usually reported.
(2) What can I compare this number to?
(a) Is this number large or small compared to other similar values? Is there a natural "denominator"?

- Yearly US fatalities from other causes of death?
    - about 1/3 as many as lung cancer: [approximately 125,000 deaths in 2025](https://www.cancer.org/cancer/types/lung-cancer/about/key-statistics.html).

    - about 10 times more than plane crashes: [357 deaths in 2022](https://injuryfacts.nsc.org/home-and-community/safety-topics/airplane-crashes/)

        Are planes or cars more dangerous?

        |Vehicle| deaths | deaths / driver| deaths / mile|
        |---|---| --- | --- |
        | Car | $4.2 \times 10^4$ | $1.8 \times 10^{-4}$, or 180 per 100,000 | $10^{-5}$, or 1 in 100,000|
        | Plane  | $3.5 \times 10^2$ | $4.6 \times 10^{-4}$, or 460 per 100,000 | < $3.5 \times 10^{-7}$, or 0.035 per 100,000 |

        [Source 1](https://en.wikipedia.org/wiki/Pilot_licensing_and_certification#:~:text=people%20to%20fly.-,Statistics,the%20UK%20NPPL(A).), [Source 2](https://www.transtats.bts.gov/traffic/)

    - <font color="maroon">The numbers are all solid, but still, the comparison is subjective!</font>
What would I have expected this number to be? (a) Is the number surprising? Does it seem plausible?
Ballpark estimates#
How can we decide if a number is surprising?
Even if we don’t have solid information, we can establish a baseline by making a ballpark estimate.
Suppose we want to estimate some quantity, such as the number of people who tour Stanford campus each year.
We’ll take the following approach:
Think about breaking the quantity up into components.
Estimate each component approximately, with our best guess.
It is usually easy to approximate by the closest factor of 10.
We hope to get within an order of magnitude (a.k.a. a multiple of 10) of the correct answer. In other words, if the truth is \(A\) and our ballpark guess is \(B\), we want \(|\log_{10}(A) - \log_{10}(B)| \le 1\).
Ballpark Estimate 1: Stanford tours#
How many visitors go on guided tours at Stanford per year?
Break the quantity into components:
(# visitors / year) = (# days/ year) x (# tours/ day) x (# visitors / tour)
Estimate each component approximately, with our best guess.
(a) There are 365 days per year.
Probably there are not tours every day, e.g. New Years' day. But let's ignore this for now, we're just trying to be approximately correct.
(b) How many tours are there per day?
 Not sure about this. Let's try to get within a factor of 10. Is it closer to 1,10, or 100?


 Probably 10.
(c) How many visitors are there per tour?
 Again, let's guess within a factor of 10. Is it closer to 1,10, or 100?


 Probably 100.
Compute the estimate:
(# visitors / year) \(\approx 365 \times 10 \times 100 = 365,000\).
The true value is about 100,000. We are within a factor 3.65 of the truth!

How could we have improved our estimate?
Ballpark Estimate 2: Food stamp fraud#
This example is borrowed from the UW course of Bergstrom and West.

Is $70 million a big number?
What type of quantity is this? Would it be more helpful to convert it?
What should we compare it to?
The denominator, the yearly budget of the food stamp program.
We don’t know this denominator. But we can get a ballpark estimate, and then see if $70 million is large in comparison.
Break up the quantity into components:
(yearly budget) = (# recipients) x ( $ per recipient per year)
= (US population) x (fraction on foodstamps) x ( $ per recipient per year)
Estimate each component:
(a) US population \(\approx 300\) million. (b) Fraction on foodstamps: is it closer to 1/100 or 1/10?
(c) Dollars per recipient per year: is it closer to $100, $1000, $10,000, or $100,000?Compute the estimate:
(yearly budget) \(\approx 300,000,000 \times (1/10) \times \$1,000 = \$30\) billion \(= \$3 \times 10^{10}\).
How does $70 million compare to $30 billion?
It’s about 0.25%. Seems like a pretty small fraction of the budget is going to fraud.
The actual annual food stamp budget in 2016 was \(6.75 \cdot 10^{10}\), so our estimate was a factor \(\approx 2\) too small.
So our estimate is pretty good, on a logarithmic scale.
What was the true fraud percentage? According to the true denominator, less than 0.1%. But funny story, it turns out the numerator was not accurate… see here.
Ballparking practice#
How many bike trips (from point A to point B) happen on Stanford campus on an average day?
How many hours per year does the average Stanford student spend on homework?
How much money is spent on college tuition in the US each year?
How large is the circumference of the earth in miles?
Fermi problems#

The practice of trying to get a ballpark estimate for a number from limited information is sometimes called a “Fermi problem,” after the physicist Enrico Fermi who was fond of such estimation questions.
For example, at the Trinity nuclear bomb test (the first ever test detonation of a nuclear bomb), Enrico Fermi was with the rest of the scientists, miles away from the detonation site.
In order to estimate the strength of the bomb, he threw a bunch of ripped up pieces of paper into the air when he felt the shock wave, and then measured how far away from him they landed. Based on this he was able to produce a very accurate estimate (within a factor 2) of the strength of the blast.