Lecture 15: Correlation#
Fundamental Statistics, part 3.
STATS 60 / STATS 160 / PSYCH 10
Concepts and Learning Goals:
Correlation
Scatterplots and best-fit line
Correlation vs. causation
Effects of outliers on correlation
Associations between variables#
Often, our datapoints contain measurements of multiple variables:
Medical: (age, weight, blood pressure)
Real estate: (price, square footage)
The penguins: (flipper length, body mass, beak length)
Often we want to understand whether two variables are positively or negatively associated.
Example: should the body mass of a penguin be positively or negatively associated with beak length?
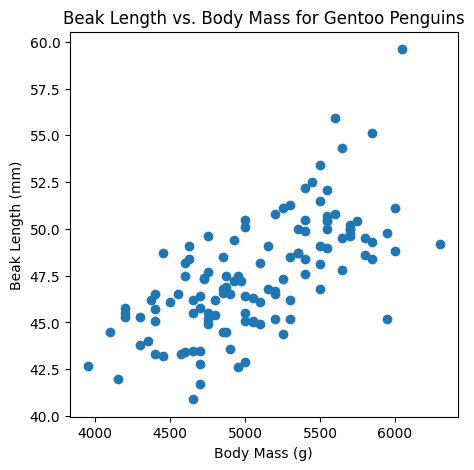
It looks like there is a positive association between the
body massandbeak length: from the plot, heavier penguins tend to have longer beaks.
How can we quantify the positive association?#
We want a quantitative measurement of the positive association between variables.
Question: Brainstorm ideas for quantitative measurements we could use.
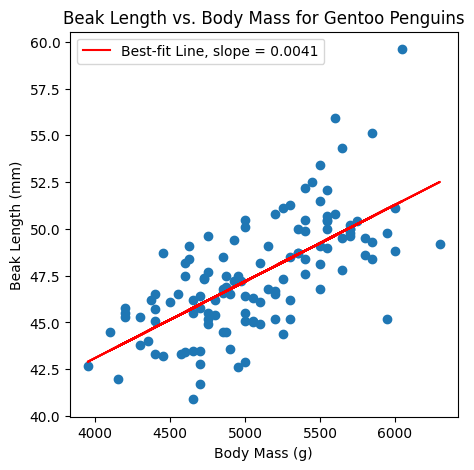
Idea: the slope of the best-fit line?
The slope is sensitive to variability.#
Some variables have smaller variability than others. That means that the slope can never be too large.
Example: beak length has a smaller variability than body mass.
Question: What is the slope of the line between the points \((0,0)\) and \((100,1)\)?
Question: Explain why if the variable \(X\) varies in the range of \(0\) to \(100\), and \(Y\) varies in the range \(0\) to \(1\), then the slope of the best-fit line will probably not get close to 1.
The slope is sensitive to units.#
Units can also change the slope.
Question: why?
If we measure the penguin body mass in ounces instead of in grams, the value of the slope changes:
Idea: rescale the data first?
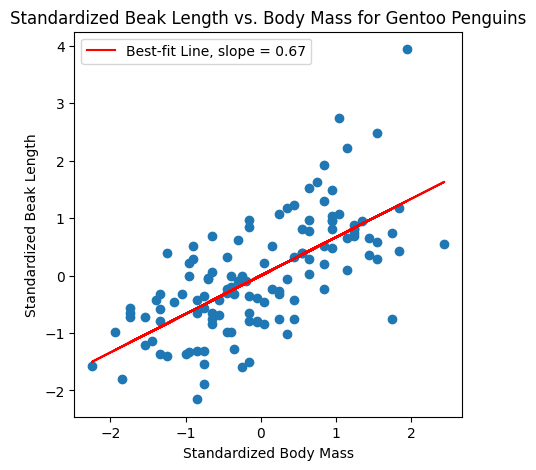
Standardizing the data#
We first standardize the dataset: we shift and rescale the data so that it has mean zero and standard deviation 1.
To standardize the dataset \(x_1,x_2,\ldots,x_n\):
Subtract the mean \(\bar{x}\) from every point
Divide all of the points by the standard deviation \(\sigma_x\).
The standardized data is \(z_1,z_2,\ldots,z_n\), where \(z_i = \frac{x_i - \bar{x}}{\sigma_x}\).
Question: What is the mean of a standardized dataset? What is the standard deviation of a standardized dataset?
Variability equalized: If we start with datapoints \((x_1,y_1),\ldots,(x_n,y_n)\), when we standardize the \(x\)’s and \(y\)’s to get \(z\)’s and \(w\)’s, the standard deviation of the \(z\)s and of the \(y\)s is the same.
Notice that the standardized data is unitless; the units of \(\sigma_x\) are the same as those of \(x_i\) and \(\bar{x}\), so they divide out.
Correlation coefficient#
Our dataset contains pairs \((x_1,y_1),\ldots(x_n,y_n)\), and we want to measure the association between the variables \(x\) and \(y\).
The correlation coefficient is the slope of the best-fit line between the standardized \(x\) and \(y\) datapoints.
You can compute it with the formula $\( \text{correlation coefficient} = R_{x,y} = \frac{1}{n}\sum_{i=1}^n \frac{(x_i - \bar{x})(y_i-\bar{y})}{\sigma_x \sigma_y }, \)\( where \)\bar{x},\sigma_x\( are the mean and standard deviation of the \)x\('s, and \)\bar{y},\sigma_y\( are the mean of and standard deviation of the \)y_i$’s.
Perfect positive correlation#
If the x,y variables are perfectly correlated, then the correlation coefficient \(R_{x,y} = 1\).
import numpy as np
import matplotlib.pyplot as plt
n = 400

X = np.random.randn(n) # Generate 100 perfectly correlated pairs (X,Y)
Y = X
plt.scatter(X,Y)

Z = (X - X.mean())/X.std() # Standardize
W = (Y - Y.mean())/Y.std()

R = sum([Z[i]*W[i] for i in range(n)])/n # Compute correlation coefficient
print("R is ",f"{R:.2f}")
R is 1.00
Perfect negative correlation#
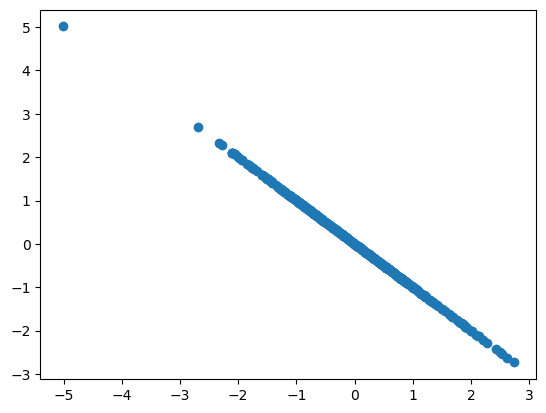
If the x,y variables are perfectly anti-correlated, then the correlation coefficient \(R_{x,y} = -1\).
X = np.random.randn(n) # Generate 100 perfectly anti-correlated pairs (X,Y)
Y = -X
plt.scatter(X,Y)

Z = (X - X.mean())/X.std() # Standardize
W = (Y - Y.mean())/Y.std()

R = sum([Z[i]*W[i] for i in range(n)])/n # Compute correlation coefficient
print("R is ",f"{R:.2f}")
R is -1.00
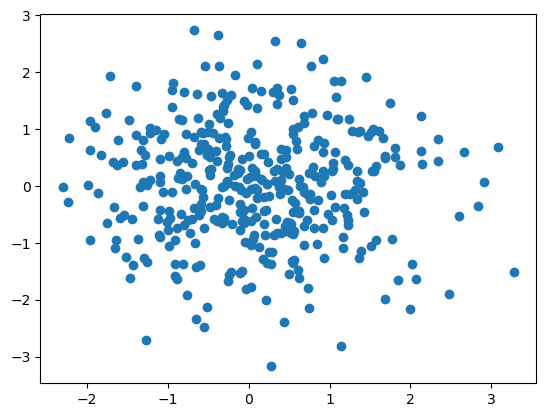
Uncorrelated variables (no relation)#
If the x,y variables are uncorrelated, then the correlation coefficient \(R_{x,y} \approx 0\).
X = np.random.randn(n) # Generate 100 uncorrelated pairs (X,Y)
Y = np.random.randn(n)
plt.scatter(X,Y)

Z = (X - X.mean())/X.std() # Standardize
W = (Y - Y.mean())/Y.std()

R = sum([Z[i]*W[i] for i in range(n)])/n # Compute correlation coefficient
print("R is ",f"{R:.2f}")
R is -0.03
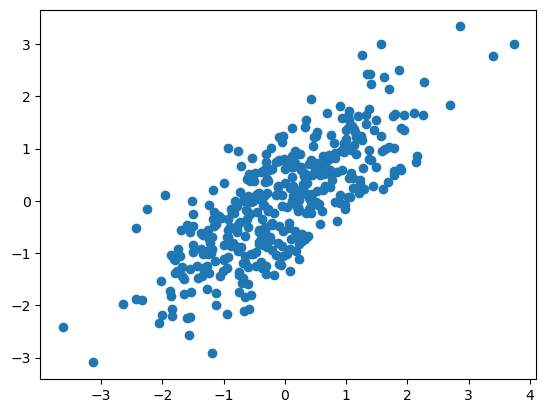
Somewhat correlated variables#
Her the x,y variables are only somewhat correlated.
X = np.random.randn(n) # Generate somewhat correlated pairs (X,Y)
Y = 0.7 * np.random.randn(n) + 0.75 * X
plt.scatter(X,Y)

Z = (X - X.mean())/X.std() # Standardize
W = (Y - Y.mean())/Y.std()

R = sum([Z[i]*W[i] for i in range(n)])/n # Compute correlation coefficient
print("R is ",f"{R:.2f}")
R is 0.78
Back to the penguins#
If \(x\) is penguin body mass and \(y\) is penguin beak length, then in our dataset the association is positive, but not perfect.
\(R \approx 2/3\).
Correlation#
Sometimes we are also interested in the correlation, which is
This formula gives the same thing as the correlation coefficient, except that here we don’t rescale by the standard deviations.
What can correlation tell us?#
Correlation and the correlation coefficient are summary statistics that quantify the association between two variables in a dataset.
Later, we will see that correlation allows us to estimate the average beak length for a penguin of a given weight.
Conceptual takeaways#
Correlation is a summary statistic of a scatterplot.
If there is a strong association between two variables, then knowing one can help a lot in predicting the other (more on this later).
When there is a weak association, information about one variable does not help much in guessing the other.
Properties of correlation#
The correlation coefficient is unitless.
Changing units of \(x\) or \(y\) does not change the correlation coefficient.
Correlation and the correlation coefficient do not change if we interchange \(x\) and \(y\): both statistics are symmetric.
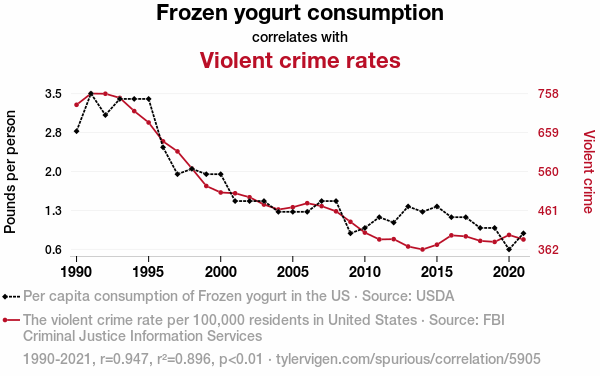
Correlation vs. causation#
Question: If \(X\) and \(Y\) are correlated, can we infer that \(X\) causes \(Y\) or that \(Y\) causes \(X\)?
NO!!!!! Many variables are correlated, but there is no causal relationship.
Here, the correlation coefficient is \(R = 0.947\).
Robustness#
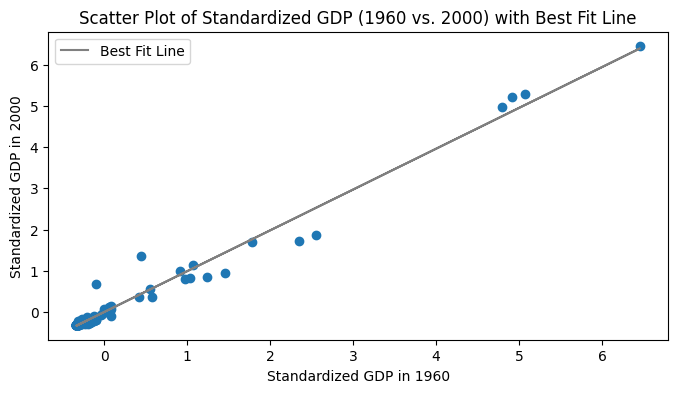
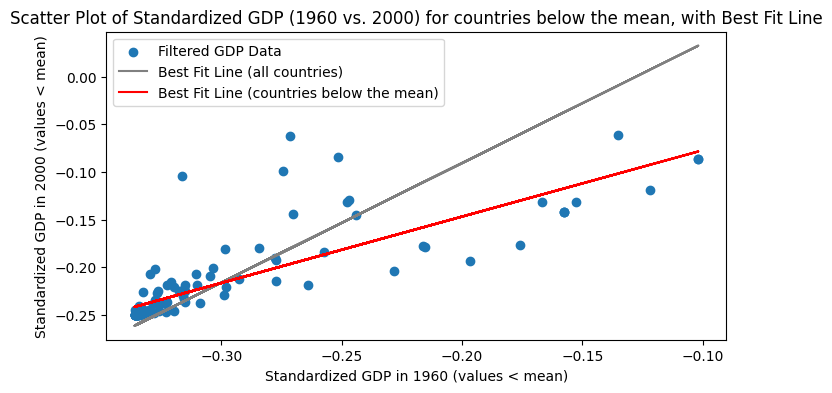
Like mean and standard deviation, outliers can greatly affect the correlation.
In the GDP dataset, about 83% of countries had GDP below the mean. Let’s look at the correlation of GDP in 1960 vs. 2000.
All countries#
Below-mean countries#
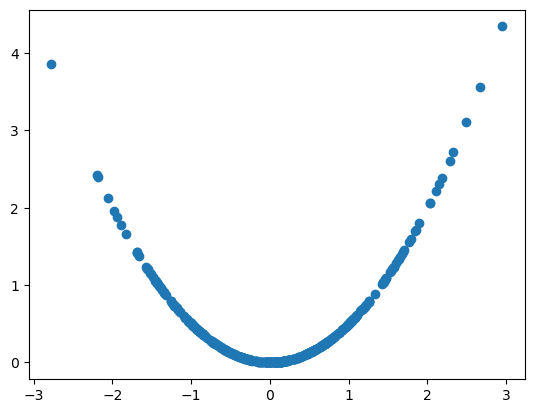
Associations not captured by correlation#
Variables can be associated without being linearly associated.
X = np.random.randn(n) # Generate 100 random samples
Y = 0.5 * X*X                # Y is a quadratic function of X
plt.scatter(X,Y)

Z = (X - X.mean())/X.std() # Standardize
W = (Y - Y.mean())/Y.std()

R = sum([Z[i]*W[i] for i in range(n)])/n # Compute correlation coefficient
print("R is ",f"{R:.2f}")
R is 0.15
Recap#
We introduced the correlation coefficient, a summary statistic that measures association of pairs of variables.
When the two variables
XandYare linearly related, their correlation quantifies the strength of this linear association.Outliers can affect correlation
Correlation is not causation!